
17.5 Fungal growth in liquid cultures
Some fungi grow in liquid cultures in a dispersed, homogenous manner but most will naturally grow in the form of mycelial clumps or pellets:
- Moulds which grow as disperse mycelia and form more or less homogeneous cultures, e.g. Geotrichum candidum, the hyphae of which fragment spontaneously (Fig. 10A).
- Moulds which grow as dispersed mycelia but aggregate in stationary phase, forming a large mycelial mass, e.g. Neurospora crassa.
- Aggregation of N. crassa is associated with accumulation of galactosaminoglycan in the medium, which helps bind the hyphae together.
- Moulds whose spores aggregate on germination and result in the formation of a number of macroscopic spherical colonies or pellets, e.g. Aspergillus nidulans (Fig. 10B).
 |
|---|
| Fig. 10. Morphology of moulds in submerged culture (shake flask or stirred liquid cultures). Appearance of liquid cultures of filamentous fungi (grown in fermenters and then decanted into 9 cm Petri dishes for photography). A, dispersed, homogenous growth of Geotrichum candidum. B, mycelial pellets as might be formed by fungi such as Aspergillus nidulans. |
We should not underestimate the impact of these growth patterns on maintaining balanced growth and therefore establishing the kinetic characteristics of the theoretical growth curve in practice. With organisms that grow as single cells (bacteria, yeasts, protozoa and animal cell cultures, unicellular algae) the task is relatively easy, as successive and representative samples can be taken from the same culture as it is incubated so that the cell count (= cell density) can be established. It is then just a matter of establishing statistical validity by taking repeated samples from each culture (to ascertain the precision of individual measurements) and running the experiment with a sufficient number of replicate cultures (to determine and measure the experimental variation).
Organisms that are not so easy to deal with are those animal and plant cell cultures that grow as congruent cell layers or calluses and the filamentous fungi; all of which (including those filamentous fungi that grow as pellets) present the experimenter with the problem that representative samples cannot be taken from the same culture. In these circumstances to get even a simple measure of growth rate over an extended culture period requires that whole cultures are harvested at each time point, and means that many replicate cultures have to be started at the same time to ensure good measurement of precision and variability throughout the incubation.
The type of measurement that is made is also influenced by growth pattern. The object of the experiment is to measure the live biomass content of the culture. Where cells cannot be counted, biomass dry weight is the most frequently-used alternative but this raises technical concerns. The harvesting and drying methods are not always straightforward, and at early growth stages there may be so little biomass that accurate weighing can become an issue. Attempts to distinguish between live and dead biomass (which dry weight does not achieve) have led to other measurements being used, including:
- content of DNA, which should primarily measure the number of nuclei, and
- ergosterol, which is expected to be a measure of the mass of fungal membranes, even if the sample is contaminated with animal and/or plant tissues (for example, when measuring fungal growth in compost, soils or solid tissues, such as mycorrhizas in/on plant roots).
- Recently, quantitative PCR (qPCR) with species-specific primers has been used both to quantify the mycelial biomass of Lentinula edodes growing in wood and estimate the kinetics of fungal growth during the decomposition process (Jomura et al., 2020).
Experiments with the Quorn fungus, Fusarium venenatum described below used image analysis of microscope images to measure total filament length and branching during early stages of growth in liquid cultures. This allowed integration of biomass measurements with hyphal growth parameters, particularly the hyphal growth unit (hyphal growth kinetics is discussed in Chapter 4; see particularly the sections entitled Mycelium growth kinetics and Growth kinetics; CLICK the section titles to view now).
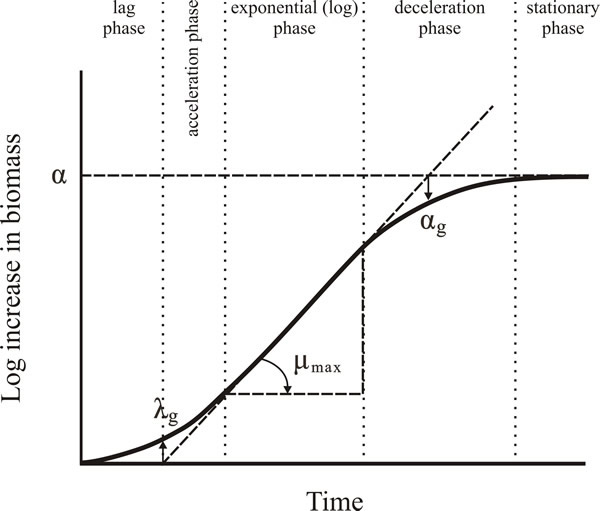
Organisms that grow in a dispersed manner have identical growth kinetics to unicellular organisms such as yeast and bacteria: growth curves (Fig.11, below) expressing biomass or cell numbers against time of incubation display a lag phase, acceleration phase (caused by the fact that not all cells in the inoculum start growing at the same time), exponential phase, deceleration phase (caused by the concentration of the carbon source, the limiting nutrient in the medium, decreasing below that needed to support μmax), and stationary phase, and stationary phase (caused by exhaustion of the carbon source). This description applies to a medium in which the limiting nutrient is the carbon and energy source, such as glucose. When the limiting nutrient is not the carbon and energy source the situation is more complicated because of unbalanced growth.
 |
|---|
| Fig. 11. The hypothetical growth curve (‘classic growth curve’) for a cell population grown in submerged liquid culture. parameters μmax (maximum specific growth rate), λg (lag phase), αg (end of exponential phase), and α (asymptote; which is the straight line that is the limiting value of the curve); λg is determined as the time where the tangent crosses the starting level, αg is determined as the time where the tangent crosses the asymptote. |
The growth curve of a filamentous fungus in batch cultures follows essentially the same kinetics as the growth curve of a unicellular organism. Exponential growth being described by the equation:
![]()
where, μ = specific growth rate and x = biomass concentration.
On integration this is transformed to:
![]()
You can see the similarity of this to the equation y = mx + c, which is the classic linear relationship of the ‘straight line graph’, so you might expect to be able to plot loge(biomass) on the vertical axis, against time (on the horizontal axis) and obtain the value of μ as the slope of the resultant graph; but this only applies to the exponential phase of a typical growth curve, and the growth curve is a curve so this straight line is more formally the tangent of that curve.
Remember, that in the growth curve of a typical organism in a batch culture there is a lag phase before the exponential phase, during which the cells become adapted to the growth conditions and initiate synthesis of RNA, enzymes and other molecules that growth and nuclear divisions require. After the exponential phase nutrients begin to become depleted and growth rate begins to decelerate until nutrient is exhausted and the organism enters stationary phase (Fig. 11). In practice, most artificial media are designed so that the carbon source is the first nutrient to be exhausted. The exponential phase of the growth curve in Fig. 11 shows the most significant parameters:
- μmax (maximum specific growth rate), as the slope of the tangent of the exponential curve;
- λg (lag phase), is determined as the time where extrapolation of the tangent of the exponential curve intersects the time axis;
- α, which is determined as the extrapolation of the asymptote, which is the straight line that the stationary phase part of the curve approaches more and more closely but never quite reaches;
- αg (the end of exponential phase), which is described as the time where the extrapolation of the tangent of the exponential curve intersects the asymptote.
The slope of the tangent of the exponential curve is the maximum specific growth rate, but another useful parameter that can be calculated using the tangent of the exponential curve is the time it takes to double the biomass (or the number of cells in a unicellular culture), which is called the mean doubling time, often symbolised Td (Table 5).
Table 5. Doubling times of
some moulds in liquid batch culture |
|||
|---|---|---|---|
| Species | Incubation Temperature (°C) |
Medium* |
Doubling Time (Td, h) |
Fusarium venenatum |
30 |
Minimal |
2.48 |
Neurospora crassa |
30 |
Minimal |
1.98 |
Geotrichum candidum |
30 |
Minimal |
1.80 |
| *Growth on complex medium is faster than growth on minimal medium because some macromolecules are supplied in the medium and do not have to be synthesised de novo. | |||
Updated July, 2020