


1. Biochemical genetics
I continued what was then the traditional approach to microbial genetics into my immediate postdoctoral work in which I prepared an allele map of a single (but complex) gene which we subsequently found to be the structural gene for the main sugar transporter (Moore, 1972; Taj-Aldeen & Moore, 1982). Results of crosses between alleles were quite variable so this experience added to my scientific prejudices the need for application of good statistical techniques to extract results from many replicate experiments. Only statistical analysis of the much-replicated crosses revealed reliable recombination values which contributed to an internally consistent gene map which finally featured 52 alleles, was based on over 400 crosses between those allelic mutants (Moore, 1972), and prompted me to speculate on the mechanism of recombination (Moore, 1974a). These experiences schooled me in the formal genetical approach of interpreting the behaviour of cellular organelles (chromosomal segments in this case) from entirely indirect experiments. The geneticist’s classical cycle of cross, count, calculate, conjecture, then check.
In this classical approach chromosome maps were built exclusively using recombination frequencies. Of course, the situation today has changed to one in which chromosomal DNA molecules are mapped directly in terms of their exact nucleotide sequence. Progress with the conventional recombination frequency approach was summarised in the first molecular analysis in this way [note that the acronym RAPD stands for randomly amplified polymorphic DNA; it is a type of PCR (polymerase chain reaction) in which random fragments of DNA are amplified using arbitrary short primers (of 8 to 12 nucleotides), the primers will bind consistently somewhere in the sequence, but it is not necessary to know in advance where they bind because their pattern of binding to the DNA fragments is repeatable and provides a unique profile which can be used as a genetic phenotype. RAPDs depend on differential PCR amplification of a sample of DNA; RFLPs (restriction fragment length polymorphisms) are similar molecular markers which depend on differential digestion of cloned DNA fragments by restriction enzymes; any one RFLP marker is specific to a single clone/restriction enzyme combination and this constitutes a reliable genetic phenotype]:
'In this report, we present a genetic map of C. cinereus [= Coprinopsis cinerea], which was constructed based on the segregation of 219 RAPD markers, 28 RFLP markers and two mating type loci in a mapping population comprising 40 progeny. The conventional linkage maps of this fungus have been constructed using [...a combination of random spore and tetrad analysis...] [with] biochemical and morphological markers (Day & Anderson, 1961; Moore, 1967; North, 1987; Takemaru, 1982) and a combined linkage map composed of 10 linkage groups was presented afterward (Casselton, 1995; North, 1990). These maps represented only part of the 13 chromosomes in this fungus' (quoted from p. 99 of Muraguchi, Ito, Kamada & Yanagi, 2003).
Muraguchi et al. (2003) presented a combined recombinational and structural genetic linkage map of all thirteen linkage groups (see their Fig. 2 on their page 98) which were correlated to the 13 chromosomes of this fungus by hybridisation of RFLP and RAPD marker probes to CHEF electrophoresis blots of intact chromosomal DNA. Their entire linkage map covered a total of 1346 cM (centi-Morgans; one cM is equivalent to a recombination frequency of 1%) and comparing this to the haploid genome size of 37.5 Mbp (million base pairs) quoted by these authors yields an average kb/cM ratio in this cross of approximately 27.9 kb/cM. This latter calculation assumes that recombination rate is uniform across all chromosomes, though this was shown not to be the case when the definitive chromosomal map of Coprinopsis cinerea was published as the result of an 'industrial scale' (with 49 authors) international effort (Stajich, Wilke, Ahren et al., 2010).
The best way to do justice to the achievement of Stajich et al. (2010) is with the following quotation from the abstract of their paper [I have added explanatory notes of my own in square brackets]:
'...The 37-megabase [1 megabase = 1 Mbp] genome of Coprinopsis cinerea was sequenced and assembled into 13 chromosomes [chromosomes range in size from 0.98 Mb to 4.15 Mb]. Meiotic recombination rates vary greatly along the chromosomes, and retrotransposons [transposable DNA sequences that are first transcribed into an RNA template, then reverse transcribed into DNA, to be inserted into a new site in the genome] are absent in large regions of the genome with low levels of meiotic recombination. Single-copy genes with identifiable orthologs in other basidiomycetes [orthologs (this US spelling is used more widely than the English orthologue) are genes in different species that evolved from a common ancestral gene during divergence of the species; orthologs usually retain the same function] are predominant in low-recombination regions of the chromosome. In contrast, paralogous multicopy genes are found in the highly recombining regions [paralogs are genes related by duplication; paralogs usually evolve new functions, possibly related to that of the original gene], including a large family of protein kinases (FunK1) unique to multicellular fungi. Analyses of P450 and hydrophobin gene families confirmed that local gene duplications drive the expansions of paralogous copies and the expansions occur in independent lineages of Agaricomycotina fungi. Gene-expression patterns from microarrays were used to dissect the transcriptional program of dikaryon formation (mating). Several members of the FunK1 kinase family are differentially regulated during sexual morphogenesis, and coordinate regulation of adjacent duplications is rare. The genomes of C. cinerea and Laccaria bicolor, a symbiotic [specifically, ectomycorrhizal] basidiomycete, share extensive regions of synteny [synteny is the physical co-localisation of genetic loci on the same chromosome in different species; recently-diverged species show similar blocks of genes in the same relative positions in the genome]. The largest syntenic blocks occur in regions with low meiotic recombination rates, no transposable elements, and tight gene spacing, where orthologous single-copy genes are overrepresented.' (Stajich, Wilke, Ahren et al., 2010).
Summary plots of the 13 chromosomes of Coprinopsis cinerea (which you can download for your own use; CLICK HERE) are published by Stajich et al. (2010) in the supplementary information which accompanies the main paper. These plots show the location of telomeres and centromere; the density of transposable elements; tRNA genes; recombination rates; the density of all genes; the density of orphan genes [protein-coding regions that have no homologues in distantly related species]; the density of orthologous genes; the density of paralogous genes; a representation of the similarity of paralogous families; and a map of the syntenic regions between C. cinerea and Laccaria bicolor. If you download the figure(s) you will also need to download the supplemental text which includes figure legends CLICK HERE.
My Ph. D. research was not limited to classical chromosome mapping; my genetic crosses involved nutritional mutants which needed biochemical analysis to identify their metabolic basis and this also formed an important strand of my doctoral research. In terms of simple nutritional tests, one methionine-requiring auxotroph is much like any other methionine-requiring mutant until the defective steps in metabolism can be identified. The same is true for mutants auxotrophic for adenine, although these provided a particular challenge by demanding purely chemical approaches to identification of precursors and intermediates as well as biochemical and enzymological analyses (Moore, 1967b). By the end of my Ph. D. project I was adept at genetical and general data analysis, as well as a rich collection of techniques in biochemistry, enzymology and even analytical organic chemistry. Add to these the continuing fascination with microscopy that had brought me into biology at school and the stage was set for my first exposure to developmental biology.
In the early 1970s my Manchester colleague, George Stewart, discovered that NADP-linked glutamate dehydrogenase (NADP-GDH) was derepressed specifically during development of caps of fruit bodies of Coprinopsis cinerea but was absent from the stems of those same fruit bodies (Stewart & Moore, 1974). During more-or-less the same time period, my first postgraduate student, Henry Waters, co-supervised by Ron Butler, undertook a study of sclerotium structure and development in C. cinerea (Waters, Butler & Moore, 1975a; Waters, Moore & Butler, 1975b). These projects defined the two directions of the next 40+ years research interests: an interest in fungal metabolism and its control on the one hand, and an interest in fungal developmental biology on the other hand.
Metabolism in filamentous fungi. Most of my research over the years has been done with the small Ink Cap field mushroom Coprinopsis cinerea, but at various times we have also worked with cultivated species like the button mushroom (Agaricus bisporus), shiitake (Lentinula edodes), paddy-straw mushrooms (Volvariella volvacea and V. bombycina), and oyster mushrooms (Pleurotus spp.). After PhD graduation I moved to an Assistant Lectureship in Genetics at the University of Manchester in 1966. With a free choice of research topics I decided to study the biochemical genetics of carbohydrate metabolism in Coprinopsis (which was then called Coprinus lagopus and later, Coprinus cinereus).
The background of knowledge that existed when I started my research was greatly influenced by the studies of fungal physiology complete by Lillian Hawker and her students in the 1930s and 1940s. These researches (done almost exclusively with Ascomycota) showed that simple sugars tend to favour asexual spore production, while disaccharides and polysaccharides are especially good carbon sources for production of fruit bodies. Glucose often represses fruit body production, even in very low concentrations, but Hawker (1939) showed that whilst perithecia of Sordaria were not formed on a medium containing 5% glucose, they did form if the same amount of sugar was supplied in small increments. Most physiological studies deal with nutrient concentration as the experimental variable; this being technically very easy to control. Hawker’s work, on the other hand, stresses the importance of rate of supply and ease of use of substrates as determinants of their value in promoting fruit body formation. For example, Hawker & Chaudhuri (1946) showed that it was the rate with which a fungus could hydrolyse a carbohydrate which determined its ability to promote fruit body formation. Carbohydrates which were hydrolysed at an intermediate rate, providing adequate but not excessive concentrations of hexose over a long period allowed production of the largest number of fruit bodies (Fig. 1).
 |
| Fig. 1. Typical graphs relating mycelium and fruit body biomass production of Ascomycota to carbohydrate concentration for (A) a readily used simple carbohydrate like glucose, (B) a more complex oligomeric or polymeric carbohydrate which the fungus can efficiently degrade and utilise, and (C) a poorly-used carbohydrate. Note that substrate category B is generally more supportive of fruit body production. Revised after Hawker & Chaudhuri (1946). |
In addition to concentration, Hawker (1947) found that the ease with which a carbohydrate was phosphorylated is an important factor in determining the effect of that carbohydrate on fruit body formation. Despite the enormous volume of research which has been done since Hawker’s experiments (for reviews see Moore-Landecker, 1993; Jennings, 1995; and chapter 4 of Moore, 1998a), the greatest insight has come from her work. I think the key understandings are, first, that the conditions under which experiments are carried out in the laboratory are totally abnormal as far as the organism is concerned, and, second, that nutrients which are inferred to be ‘favourable’ for fruiting are those which allow the organism to exert its own intrinsic controls over the progress of its metabolism. This last sentence stresses my belief that, whilst there is a continuing need for nutrient supplies from the substrate, the most important aspect of the mode switch between a vegetative hypha and a hypha undergoing a morphogenetic process is that the regulation of metabolism devolves to the inner environment of the hypha. Under natural circumstances the regulatory influence of the external environment would then be minimised to influencing choice of pathways, etc. In the unnatural circumstances of Petri dish or fermenter the experimenter can still, of course, blunder in with his bottle full of purified chemical and thereby disturb the entire course of events. This line of argument introduces the concepts of competence and commitment; when the hypha internalises control over its nutrient supplies it becomes competent to initiate patterns of development for which it has already captured sufficient supplies to become committed (Fig. 2).
 |
| Fig. 2. A flow chart of the overall relation between growth, respiration and sporulation as described by Lillian Hawker (Hawker, 1966). The initial phase of linear hyphal growth and how it relates to hyphal growth kinetics is described in Chapter 4 (pp. 86-96) in Moore, Robson & Trinci (2011). |
The distribution of nitrogen and carbohydrate between mycelium and fruit bodies of the basidiomycete Schizophyllum commune is shown in Fig. 3. Wessels (1965) used a medium-replacement technique to demonstrate that external carbon and nitrogen sources were required for formation of fruit body initials, but only external carbon source was required for further development of the initials (endogenous nitrogen supplies were sufficient). Nutritional support of the final stages of maturation of the fruit body caps bearing hymenia was completely endogenous, requiring no external sources of nitrogen or carbon. Indeed, this final stage, formation of the fruit body cap, normally occurred only after glucose was exhausted from the medium (Fig. 3).
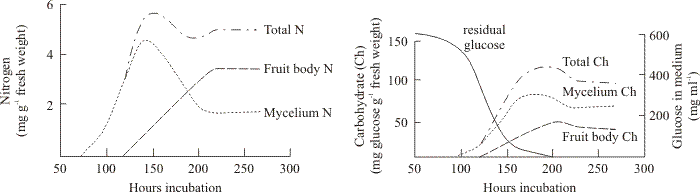 |
| Fig. 3. Changes in nitrogen and carbohydrate in fruiting cultures of Schizophyllum commune (Wessels, 1965). In these cultures fruit bodies appeared after about 100 h and steadily matured. Note that the medium becomes exhausted of glucose shortly after fruiting commences. However, these observations demonstrate that accumulation of carbohydrate into the mycelium occurs for most of the next 100 h and the mycelium always has more carbohydrate than the fruit bodies. On the other hand, nitrogen is redistributed from mycelium to fruit body tissues. |
Decline in cellular carbohydrate, particularly breakdown of cell wall polysaccharides, was associated with this stage of development. An alkali-insoluble cell wall component, which was called R-glucan, was the main fraction of the wall to be broken down (Wessels, 1969). R-glucan contained both β-(1,6) and β-(1,3) linkages and was distinct from another major wall fraction (S-glucan) which was alkali-soluble. S-glucan constituted the bulk of the cell wall material left after mobilisation of the R-glucan. Studies of the mobilisation process indicated that cell wall degradation in Schizophyllum commune correlated with cap development and was controlled by changes in the level of a specific R-glucanase enzyme as well as by differences in the susceptibility of cell wall glucans to the enzymes. R-glucanase activity was repressed by glucose in the medium (Wessels, 1966; Wessels, 1969). Thus, the model which emerged from these studies is that while glucose remains available in the medium carbohydrate is temporarily stored in the form of R-glucan in the walls of mycelial and fruit body primordium hyphae. During this phase of net R-glucan synthesis the R-glucanase is repressed by glucose in the medium, but when this is exhausted the repression is lifted, R-glucanase is synthesised and by breaking down the R-glucan it provides substrate(s) which are specifically required for cap development.
In the earliest stages of growth of the dikaryotic mycelium of Coprinopsis radiata (named as Coprinus lagopus in the original publication) glycogen was shown to accumulate in bulbous cells of the submerged mycelium (Madelin, 1960); subsequently, we detected similar accumulations in Coprinopsis cinerea (Waters, Butler & Moore, 1975a). Madelin (1960) found that the mycelial accumulations were depleted at the time of fruit body formation in Coprinopsis radiata, and presented convincing evidence for direct transfer of mass from the mycelium to the fruit body (Madelin, 1956). Accumulation of glycogen in fruit body tissue is certainly evident at very early stages of development of the Coprinopsis cinerea fruit body (Matthews & Niederpruem, 1973), and has also been observed in hymenial tissues of late developmental stages in Coprinopsis lagopus and Coprinellus curtus (Bonner et al., 1957) as well as Coprinopsis cinerea (McLaughlin, 1974).
Against this background of understanding I made a start on my contribution in the mid-1960s by determining the spectrum of carbon and energy sources that could be used by C. cinerea (as Coprinus lagopus) (Moore, 1969) and then went on to examine the effects of a number of sugar analogues on growth of the organism. The then-existing literature suggested that sugar analogues would be a good tool for study of sugar metabolism (Moore, 1981a).
Sugar analogues usually cause inhibitions to the growth of fungi by being used in metabolism in place of glucose. For example, hexokinase phosphorylates the glucose analogue 2-deoxy-D-glucose (deGlc), and its 6-phosphate inhibits the activity of other glycolytic enzymes, especially phosphohexose isomerase and glucose 6-phosphate dehydrogenase. Formation of deGlc-6P is the usual limit of metabolism of this sugar analogue and accumulation of the phosphate ester leads to a considerable drain on phosphate pools. ATP levels decline drastically and deGlc rapidly initiates degradation of purine nucleotides. In most fungi, polysaccharide synthesis is affected; preformed wall material being eroded and synthesis of new wall components prevented by sequestering of uridine and guanosine nucleotides through reaction with deGlc.
Another sugar analogue, L-sorbose is not phosphorylated, and the biochemical basis of the inhibitions caused by this analogue is more obscure. Some enzymes involved in polysaccharide synthesis are sensitive to inhibition by sorbose, and a characteristic of growth on this sugar is formation of an abnormally thick cell wall. Filamentous fungi grown on solid medium containing sorbose assume an abnormal growth form in which cells are much shortened and branching frequency is increased (causing a change in morphology is why sorbose and related compounds are called paramorphogens). There are indications that sorbose, perhaps by interfering with cell wall structure, affects hyphal morphogenesis and that this effect may be magnified into a macroscopic change in the characteristics of the colony during growth on agar medium. The literature included several examples of fungal mutants resistant to deGlc which had alterations in either transport, hexokinase or phosphatase functions and mutants resistant to sorbose that were defective in sugar transport, phosphoglucomutase or polysaccharide synthases.
I found that the glucose analogue 2-deoxy-D-glucose seriously inhibited the growth of Coprinopsis cinerea (as Coprinus lagopus), and there were some correlated morphological changes (suggesting involvement of the sugar in cell wall metabolism). For example under the influence of 2-deoxy-D-glucose, outgrowths destined to become clamp connections in Coprinopsis dikaryons continue to grow away from the parent hypha and become established as monokaryotic branches (Moore & Stewart, 1971a). I subsequently isolated many hundreds of mutants of C. cinerea which were resistant to growth inhibition by analogues of sugars. 388 mutants resistant to deGlc were isolated and shown to be probably allelic (i.e. mutants in the same cistron). The mutants were pleiotropic in the sense that although they were initially selected only for resistance to 2-deoxy-D-glucose they were found to be cross-resistant to both of the related analogues, L-sorbose and D-glucosamine. Furthermore, the mutants were unable to utilise fructose as a sole carbon source. We demonstrated that the inability to utilise fructose results from a defect in sugar transport, and the gene symbol ftr was assigned. Crosses showed that the ftr gene is quite closely linked to its own centromere but was unlinked to centromere markers of the six known linkage groups (Moore & Stewart, 1971b).
2-Deoxy-D-glucose (deGlc), D-glucosamine (GA) and L-sorbose (Sor) all inhibited extension of Coprinopsis hyphae (Moore & Stewart, 1972); but all three analogues caused gross morphological changes. The most characteristic aberration was a distinct swelling of the hyphal tip. This was most severe with GA which caused the tip cell to balloon into a spheroid some five to six times the diameter of the subtending hypha. The most extreme consequence of swelling occurred on media containing deGlc; after swelling to two to three times their normal diameters, tips frequently became vacuolated and often burst. Tip lysis was not observed on media containing either GA or Sor. Mutants of Coprinopsis selected for resistance to D-glucosamine and L-sorbose were found to be sugar transport-defective and cross-resistant to growth inhibition by the three analogues deGlc, GA and Sor. Like the mutants previously selected for resistance to deGlc, the new mutants were all shown to be alleles of the ftr cistron (Moore, 1973a). Fifty-two of these alleles were placed in an allele map using recombination frequencies obtained from over 400 heteroallelic crosses (Moore, 1972) (Figs 4 & 5).
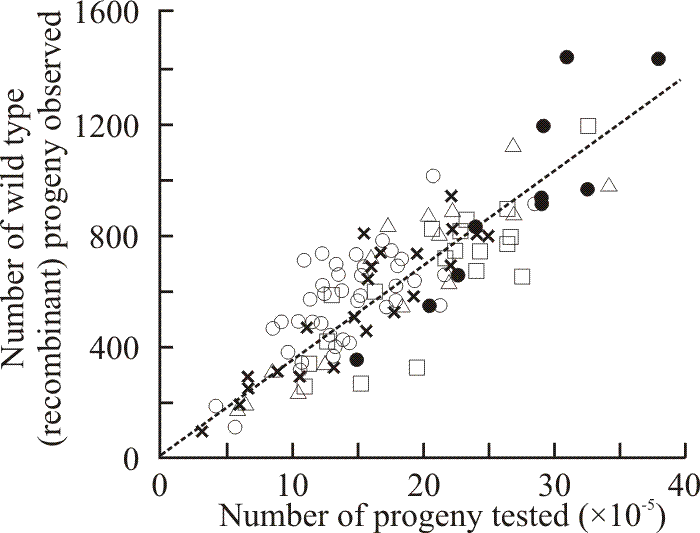 |
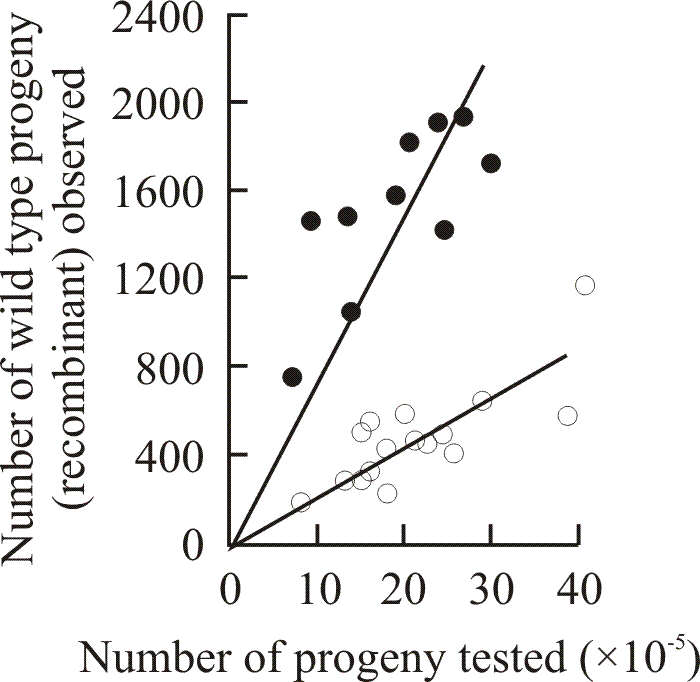
| Fig. 4. Results of 114 crosses made between strains carrying ftr alleles 154 and 492. Each point shows the result of a single cross. The line drawn is the line of regression through zero (zero progeny = zero recombinants, so the line must go through zero). Five crosses involving strains of different (recombinant) mating types are represented: Z492/6,6 × ZR154/40,40 (open circles); ZR492/40,40 × Z154/6,6 (squares); ZJ492/5,5 × Z154/6,6 (triangles); ZR492/40,40 × ZJ154/5,5 (crosses); and ZJ492/5,5 × ZR154/40,40 (closed circles). The grand average recombination frequency calculated from all 114 crosses was 34.6 ± 8.0 wild type recombinants × 10-5 total progeny. This sort of graphical display shows that although the results of these allelic crosses are highly variable, the individual results contribute to a definitive trend. Consequently, a programme of work using sufficient replicate crosses combined with simple statistical (specifically, regression) analysis is able to extract recombination frequencies that can be used for reliable point-to-point allele mapping (see Fig. 5). Data from Katy & Moore, 1980. |
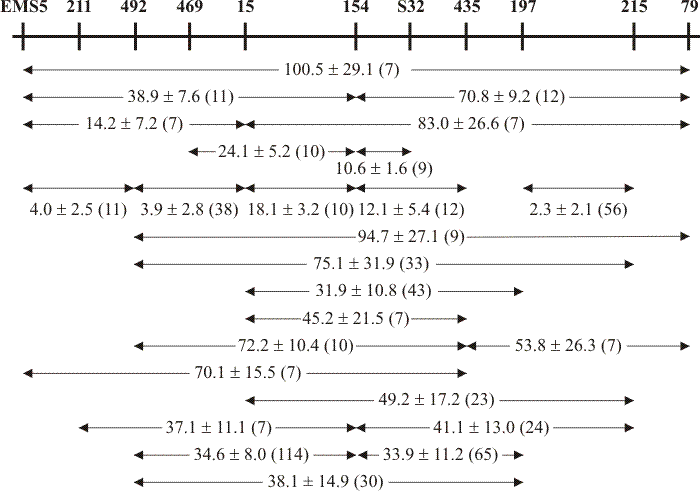 |
| Fig. 5. Partial allele map of the ftr cistron showing how point-to-point recombination frequencies can contribute to an internally consistent map of the alleles. The top line is the overall map with allele positions shown by vertical markers; allele isolation numbers are shown above the positional markers (allele numbers prefixed EMS were induced by the mutagen ethane-methane sulphonate; those prefixed S are spontaneous mutants; numbers without prefix are alleles induced with the mutagen nitrosoguanidine). Recombination frequencies (expressed as wild type recombinants per 105 progeny) are shown as the mean and standard deviation of the number of replicate crosses shown in brackets. Note that alleles EMS5 and 79 represent the known boundaries of the ftr cistron. Data from Katy & Moore, 1980. |
The mutant sites in the allele map were distinctly clustered into three approximately equally spaced regions, but clustering of the sites was not due to differential mutagenesis (Moore, 1975). On the other hand, the clusters seemed to be functionally differentiated both within themselves and from one another. The position in the allele map occupied by a particular mutant was found to depend on both the identity of the analogue and the identity of any non-inhibitory carbon source included in the selection medium (Moore & Devadatham, 1975); this implies that the mutational selection pressure is exerted on the specific molecular configuration between the transporter and that particular (inhibitory) substrate analogue.
In interpreting these data it is important to recognise that mutants belonging to the ftr cistron have all been selected for resistance to inhibitory sugar analogues on media which completely inhibited growth of wild type spores. Furthermore, mutation at any point in the cistron confers cross-resistance to all three analogues. Assuming that the ftr cistron specifies a permease protein, mutation must lead to resistance because the resultant alteration in polypeptide structure greatly diminishes the affinity of the permease for the inhibitory sugar. Differences in the distribution patterns of alleles selected under contrasting conditions must reflect variations in the affinity of the permease for the analogues. Although a defect in any part of the cistron is sufficient to affect sorbose transport, not all defects are able to so adversely affect transport as to confer selective advantage when sorbose is present in the medium. Consequently, selection of mutants on a sorbose containing medium tends to favour the identification of those changes which have occurred in positions that most seriously affect sorbose transport.
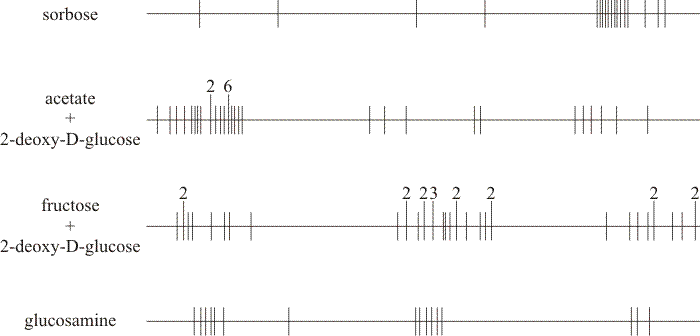 |
| Fig. 6. Distributions of alleles selected on different media in the ftr allele map. In each case the horizontal line represents the long axis of the chromosome while the vertical lines show the positions of the recombinable allele sites to approximate scale. Extended vertical lines indicate sites at which more than one allele maps; the numerals above the extended lines show the number of independently isolated alleles that occupy that position. The components of the four selection media compared are shown on the left-hand side. Compare the positions of mutants selected for resistance to sorbose (top) with those selected for resistance to glucosamine (bottom). Also, compare the positions of mutants selected for resistance to 2-deoxy-D-glucose either in the presence of acetate (that is, no normal sugar in the medium), or in the presence of fructose (centre maps). Note that all selection media caused 100% growth inhibition to the wild type. Data from Moore & Devadatham, 1975. |
These data imply that the ftr gene-product is a complex transport protein, and detailed kinetic analysis of sugar transport in the wild type supports this notion. Two transport systems for glucose were detected: a high affinity system with a Km of 27 μM, and a low affinity system with a Km of 7.5 mM (Fig. 7). Both systems accumulated against concentration gradients and both were sensitive to inhibition by metabolic poisons. Only the low affinity system could initially be demonstrated in glucose-grown tissue, although the high affinity system was restored by starvation in glucose-free medium. The half-time for restoration of high affinity activity was 3.5 min and the process was unaffected by cycloheximide (which inhibits protein synthesis); indicating that the change from low to high affinity only requires a change in protein conformation. Addition of glucose to an acetate-grown culture inactivated the high affinity system with a half-life of 5 to 7.5 seconds; again indicating change in protein conformation. Addition of cycloheximide to an acetate-grown culture caused decay of the high affinity system with a half-life of 80 min, showing that maintenance of the high affinity system requires protein synthesis and its loss requires protein turnover. Regulation is thus thought to depend on modulation of protein activity rather than synthesis, and the kinetics of glucose, 2-deoxy-D-glucose and 3-O-methylglucose uptake would be consistent with there being a single carrier showing negative co-operativity (Moore & Devadatham, 1979). In functional terms this means that:
- in the presence of substrate glucose the glucose transporter binds sugar molecules and takes on a shape that makes it into a low affinity, proton gradient-driven transporter;
- as external glucose levels decline the sugar molecules leave their binding sites on the protein, which takes on a shape that makes it a high affinity, ATP-driven transporter that is able to scavenge for substrate to transport.
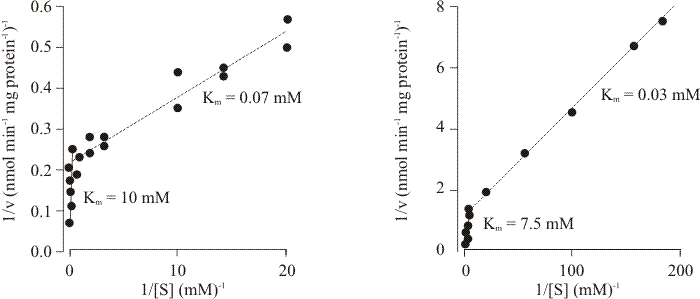 |
| Fig. 7. Initial rates of uptake of two glucose analogues as a function of concentration in Neurospora (left) and Coprinopsis (right). Note the biphasic nature of the plots, indicating that there are at least two kinetic entities in each case, one with a much higher substrate affinity than the other. Data taken from Neville, Suskind & Roseman (1971) and Moore & Devadatham (1979). |
Analysis of transport defective mutants revealed defects in both transport systems although the mutants used were alleles of a single gene. So from these data it is concluded that this ftr cistron is the structural gene for an allosteric molecule which serves both transport systems. It was eventually demonstrated that ftr alleles had approximately normal levels of activity of enzymes involved in intracellular sugar metabolism, though the mutants showed greatly depressed rates of sugar uptake. Uptake rates from 0.01 mM solutions of 2-deoxy-D-glucose were only 1 to 4% of the wild type rate, and from 15 mM solutions the mutant rates were between 16 and 40% of normal. Kinetic analysis showed that the mutant Vmax values were reduced to a few percent of normal while Km values were relatively little changed and in some cases the mutants had an increased affinity for the substrate.
Reverse mutations restored the Vmax value and the Km to about the wild type level. Previous data had shown that position of mutants within the allele map depended on selection conditions in a way that implied some interaction between the ftr gene product and the substrate. Since the mutants are defective in transport from both high and low sugar concentrations, and since they exhibit coordinated alterations in Km and Vmax, it was concluded that the ftr cistron is the structural gene for a product involved in sugar translocation (both as carrier and energisation link) in both high and low affinity glucose transport systems (Taj‑Aldeen & Moore, 1982). Using current terminology, the ftr gene product is predicted by these kinetic data to be an allosteric ATP-binding cassette hexose transporter, which couples hydrolysis of adenosine triphosphate (ATP) to the translocation of hexose across the hyphal membrane in one (the high-affinity) configuration and facilitates hexose transport by facilitated diffusion in its low affinity configuration. Such carrier proteins are generally integral membrane proteins; meaning that they exist within, and span, the membrane across which they transport their substrates. All these transporters have α-helical structures in their membrane-spanning domains that contribute to substrate translocation across the membrane and it is tempting (particularly because ftr mutants were defective in Vmax rather than Km) to suggest that the allele mutant clusters observed in the ftr allele map (Fig. 6) correspond to the membrane-spanning domains of the ftr gene product.
A gene map featuring so many alleles is relatively rare and yet is an excellent tool for study of recombination. Additivity of recombination frequencies was good over the whole of the ftr allele map (which, at the time, was not the rule for allele maps). However, specific marker effect sites could be recognised. Expression of marker effect was influenced both by the background genome and by the nature of the mutation at the second site in the heteroallelic cross (Moore, 1972). This marker effect could act to enhance (Fig. 8) or reduce recombination frequency; enhancement being equal and opposite to reduction. Marker effect enhancement was only observed when the interval being mapped exceeded a certain minimum value, but there was no upper limit to the size of the interval. However, enhancement was expressed in two entirely different ways. There was one type of site which caused a uniform doubling of the recombination frequency in all crosses no matter where the second site was placed in the map. The second type of marker effect enhancement site caused a very great increase in recombination frequency in crosses against relatively closely linked mutants, but its effect diminished as the distance between the marker effect site and the second site was increased (Moore, 1973b; Moore & Katy, 1978).
 |
| Fig. 8. Detection of marker effect genes influencing recombination between alleles of the ftr cistron. Results of reciprocal crosses reveal the presence of a recombination enhancement (recE) gene in strain ZR98/40,40 in crosses made between strains carrying ftr alleles 98 and 492. Each point shows the result of a single cross. The lines drawn are lines of regression through zero. Crosses were made between Z98/6,6 and ZR492/40,40 (open circles; average frequency of wild type recombinants 29 × 10-5); and the reciprocal strains with recombinant mating types Z492/6,6 and ZR98/40,40 (closed circles; average frequency of wild type recombinants 79.6 × 10⁻⁵). In each case the original ftr mutation was induced in a wild type of mating type A6, B6. Data from Katy & Moore, 1980. |
Both enhancement and reduction were controlled by single genes which seemed to be independent of one another (Katy & Moore, 1980). The genes were symbolised recE (for recombination enhancement) and recR (recombination reduction; feasible, because in another (molecular) study we found that meiotic recombination is inhibited within the ribosomal DNA of Coprinopsis cinerea (Cassidy, Moore, Lu & Pukkila, 1984)). Both rec genes were fully dominant, non-additive, and segregated readily from one another and from the ftr cistron. Recombination between any pair of ftr alleles was increased when recE was part of the genotype, but recE had no effect on recombination between alleles of the me-5 locus. On the other hand, the reduction of recombination caused by recR in the ftr cistron was polarised and allele-specific, but recR increased the frequency of recombination between me-5 alleles. The data were interpreted on the basis that the rec-gene products could be involved in chromatid pairing and that polymorphic variants of them caused differences in pairing which, by altering the opportunities for recombination, were observed as differences in allelic recombination frequency.
I was convinced that the then-current models of recombination did not adequately explain these data, most importantly because of their reliance on initial breakage of DNA strands in the formation of hybrid DNA. I proposed a new model for genetic recombination in which the sequence of events is:
- separation of intact double helices into single strands;
- illegitimate pairing between single strands from non-sister chromatids;
- strand breakage and exchange of covalent links so as to legitimise the illegitimately paired regions (Moore, 1974a).
The model I developed allows for the formation of hybrid DNA either with or without coincident chiasmata. The recombination process is initiated by the unwinding of the DNA helix rather than by breakage of one or both of the component strands of the helix. I argued that initial breakage is unattractive as the causal event in recombination from the evolutionary point of view and that it creates difficulties in interpretation even when considered against the background of the present day cellular environment.
In contrast, initial unwinding is capable of producing a configuration which specifies precisely the positions at which breaks must occur and which is thereby able to generate recombination events in any situation in any organism. Considerable support, both theoretical and experimental, exists for the concept of helix unwinding, and particularly for the idea that DNA helices exist in solution in a dynamic state in which short regions are continually being unwound and rewound. The model of recombination developed from these arguments accounts for the generally observed features of the process at both intragenic and intergenic levels, and in addition provides explanations for more subtle phenomena like polarisation, allele-specific marker effect and provides a natural explanation for positive chiasma interference (Moore, 1974b).
Other aspects of the carbon metabolism of Coprinopsis. Alongside this research on sugar transport, we examined other aspects of the carbon metabolism of Coprinopsis and other mushrooms. The pyruvate kinase (ATP-pyruvate phosphotransferase, EC 2.7.1 .40) reaction is an important control point for the pathways of both glycolysis and gluconeogenesis. The specific activity of Coprinopsis cinerea (as Coprinus lagopus) pyruvate kinase was high under conditions of glycolysis but low under conditions of gluconeogenesis. There was a 14- to 15-fold increase in specific activity when the glucose concentration was increased from one to 300 mM. When cultures were grown on other hexoses such as fructose and mannose the specific activity was again considerably higher than that of acetate- or glycerol-grown mycelia (these being, at best, poor sources of carbon and energy for Coprinopsis (Moore, 1969).
Only a single form of the pyruvate kinase enzyme was detectable, and pyruvate kinase activity in Coprinopsis was regulated through changes in both enzyme concentration and activity (Stewart & Moore, 1971). Regulatory properties include co-operative interactions with phosphoenolpyruvate (PEP), ATP and fructose 1,6-diphosphate. Fructose 1,6-diphosphate (FDP) almost completely reverses the inhibitory effects of ATP. The decrease in substrate co-operativity in the presence of FDP, the allosteric activator and the increase in ATP co-operativity in the presence of activator show that the enzyme can be classed as a ‘K-system’ allosteric protein (in which allosteric activators influence the apparent Km, but not the Vmax). The regulatory properties of the Coprinopsis pyruvate kinase provide a facile switch between glycolysis and gluconeogenesis that contributes to the use of glycogen as a transient carbohydrate store which became an important part of the story of developmental metabolism that I discuss below (Jirjis & Moore, 1976; Brunt & Moore, 1989; Ji & Moore, 1993)[View now].
Wild-type monokaryotic mycelia of Coprinopsis cinerea (as Coprinus cinereus) grew equally well whether glucose or fructose was given as sole source of carbon + energy. We reported (Taj‑Aldeen & Moore, 1983) an analysis of hexose phosphorylating activity in wild type and in ftr mutants which showed that Coprinopsis possesses a single hexokinase of broad substrate specificity and that ftr mutants show an unimpaired activity of this enzyme. Measurements of the specific activities of representative enzymes of the pentose phosphate cycle, Embden-Meyerhof-Parnas (EMP) pathway and the tricarboxylic acid (TCA) cycle in Coprinopsis (as Coprinus cinereus) mushroom fruit bodies at different stages of development showed glycolysis to be the major route of carbohydrate catabolism throughout fruit body development (Moore & Ewaze, 1976).
Enzymes of the pentose phosphate cycle were always at lower specific activities than the enzymes of the EMP pathway, and the activities of the pentose phosphate cycle enzymes declined drastically as development proceeded. This conflicts with reports for Agaricus bisporus, but the changes in some enzymes were qualitatively similar to those occurring in the development of the fruit bodies of Schizophyllum commune. A number of enzymes of the TCA cycle were detected, but there was no evidence for 2-oxoglutarate dehydrogenase activity nor increase of isocitrate lyase activity over the basal repressed level. However, glutamate decarboxylase and 4-aminobutyrate aminotransferase were detected, suggesting that an inoperative 2-oxoglutarate dehydrogenase could be by-passed through the glutamate decarboxylation loop (Moore & Ewaze, 1976). These results need to be discussed in relation to the changes which also occur in the specific activities of the two glutamate dehydrogenase enzymes during development of the Coprinopsis fruit body (Stewart & Moore, 1974); for which see below [View now].
The making of Coprinopsis sclerotia. Glycogen came into my story in some of the first observations we made of a developmental process in Coprinopsis. When the agar surface of Petri dish cultures has been completely covered with mycelium of Coprinopsis cinerea (Coprinus cinereus) for 4 to 5 days (this usually requiring a total of 9 or 10 days incubation), the mycelia produce small, multicellular, globose structures called sclerotia. These are probably perennating bodies, which are able to survive adverse conditions anticipated by the ageing mycelium. Both monokaryotic and dikaryotic mycelia are capable of forming them and they are a totally vegetative expression of morphogenesis. Dikaryotic mycelia are also capable of producing the mushroom fruit bodies as the culmination of the sexual cycle. Both sclerotia and mushroom fruit bodies develop from undifferentiated mycelia through an organised process of hyphal growth and branching which forms an aggregate (the ‘hyphal knot’) in which cellular differentiation occurs. The early stages of this sequence (Fig. 9) are common to the processes of fruit body primordium and sclerotium formation (Moore, 1981b), the cell mass becoming committed to one or other of these pathways as a result of the interaction of environmental factors like light and nutrition (Moore & Jirjis, 1976) with the genetic factors controlling differentiation.
The two strains we first studied differed in their sclerotial behaviour. A haploid mycelium called H1 (isolated in Hertfordshire, England) produced only aerial sclerotia whereas a completely unrelated haploid (from the Czech republic) called ZBw601 produced sclerotia on both the aerial and submerged parts of the colony. During development of aerial sclerotia only two stages were distinguishable to the unaided eye: immature sclerotia appeared as small (size range 100 to 250 μm diameter) unpigmented spheroids, these becoming pigmented as the mature sclerotium developed. Mature aerial sclerotia were dark brown to black, and more or less spherical. Three tissue layers were apparent-an outer diffuse layer, the rind and the inner medulla.
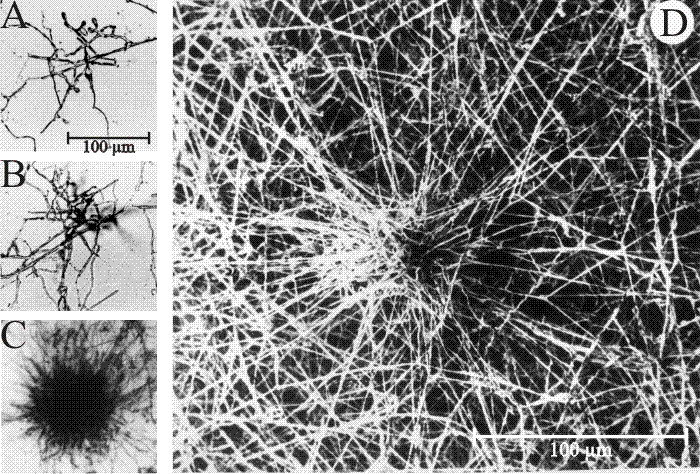 |
| Fig. 9. Structure and development of Coprinopsis sclerotia. A-D, Culture slide (microcosm) preparations of developing sclerotia of Coprinopsis cinerea. A: the earliest recognisable stage showing the centre of sclerotium initiation. B: increased size of structure as branching proceeds to form a very immature sclerotium. C: immature sclerotium showing main body with hyphae of determinate growth and the ‘long hyphae’ that appear to radiate outwards but are actually targeting inwards towards the developing sclerotium. D: Scanning electron micrograph of immature sclerotium at a stage similar to that shown in C, which shows more clearly that the long hyphae are part of the long distance nutrient translocation network that supports development of the sclerotium (A-C are light micrographs; all images from Waters, Moore & Butler (1975b) by permission of John Wiley and Sons). |
The outermost diffuse layer was composed of apparently dead hyphal cells whose cytoplasm was reduced to vesiculate and membranous fragments. Though only loosely attached this layer was always present in mature aerial sclerotia and is therefore regarded as an integral part of their final structure. The multilayered rind, in which cell walls were uniformly thickened (200-300 nm) and heavily pigmented, totally surrounded the central medulla. The young medulla contained irregularly inflated hyphal cells with contents that stained intensely with cytochemical procedures that detected polysaccharide, a feature which correlated with the large number of polysaccharide rosettes observed in electron micrographs of similar cells. In the fully mature medulla thick-walled cells predominated with the less frequent thin-walled, polysaccharide-filled, cells randomly interspersed among them (Figs 9 and 10) (Waters, Butler & Moore, 1975a).
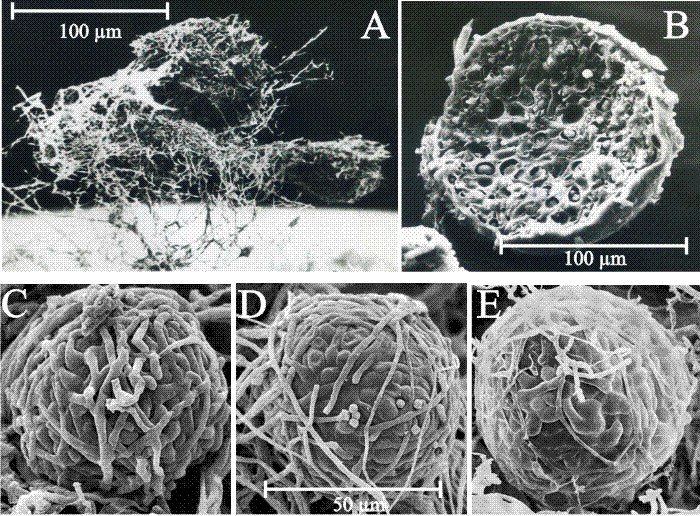 |
| Fig. 10. Structure and development of fungal sclerotia. A: Scanning electron micrograph of a group of three aerial sclerotia of C. cinerea in side view, relatively undisturbed and still showing the investing layer of mycelial hyphae and obvious aerial habit. Photographed by Dr H. Waters. The mycelial hyphae that surround the developing sclerotium, which seem so substantial in Fig. 9 , are easily lost during preparation for microscopy. B: Scanning electron micrograph of a freeze-fractured aerial sclerotium of C. cinerea. This specimen is one of a collection of sclerotia that were scraped from the surface of a Petri dish culture, suspended in glutaraldehyde fixative, filtered through cotton, dehydrated into acetone, then ground in a mortar and pestle under liquid nitrogen (to fracture the sclerotia to observe their internal structure); not much of the investing layer of aerial mycelium survives this treatment. This specimen photographed by Dr F.V. Hereward. C to E : scanning electron micrographs of the (smaller) sclerotia of Byssocorticium coprophilum (MycoBank reference Mb449580), which show more clearly that sclerotia are a ‘ball’ of filamentous hyphae and that constituent cells (compartments) of those hyphae differentiate as the sclerotium matures. Images reprinted by permission from Dr J.A. Stalpers; they originally appeared on the www.mycobank.org website at this URL: http://www.mycobank.org/MycoTaxo.aspx?Link=T&Rec=449580#Images. |
Aerial sclerotia of ZBw601 were always associated with localised areas of pigmented mycelium (called brown matting) on the agar surface which appeared one or two days before immature sclerotia were seen. In fact, colonies of ZBw601 were composed of three distinct regions: aerial mycelium, brown matting and submerged mycelium. Cells of the aerial mycelium represented the simplest vegetative hyphal condition, upon which secondary changes were imposed. The brown matting formed at the air/agar interface in Petri dish cultures consisted of a single layer of cells with pigmented wall thickening (200-300 nm thick) which was almost entirely restricted to the outer (that is, air-exposed) wall. The inner (agar-exposed) wall always remained unthickened while the lateral walls showed a gradient of thickening from their outer edges. Cells of the brown matting arose as lateral branches from both aerial and submerged hyphae; differentiation occurred when the branches contacted the agar surface. Sclerotia formed by the submerged mycelium and within the agar medium had a single-layered rind and very open internal structure. The submerged sclerotium possessed a medulla which contained cells of the same sorts and in the same proportions as occurred in the submerged mycelium and a rind comprised of cells very like those of the brown matting layer that overlaid the submerged mycelium.
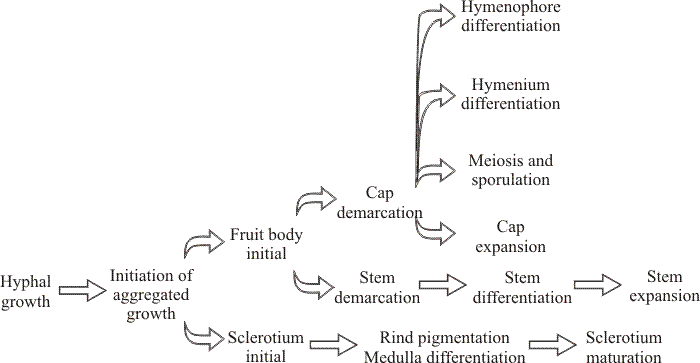 |
| Fig. 11. Genetic pathways to fruiting indicated by segregation genetics: genetically distinct pathways involved in sclerotium formation and the development of fruit body tissues in Coprinopsis cinerea. Takemaru & Kamada (1972; Kamada & Takemaru, 1977a; Kamada & Takemaru, 1977b; Kamada & Takemaru, 1983) isolated 1594 developmental abnormalities among 10,641 survivors of mutagen-treated fragments of dikaryotic mycelium. On the basis of the phenotype of the fruit body produced by the mutant dikaryons they identified the categories: knotless (no hyphal aggregations formed), primordiumless (aggregations formed but do not develop further), maturationless (primordia produced that fail to mature), elongationless (stem fails to elongate but cap development is normal), expansionless (stem elongation normal but cap fails to open), and sporeless (few or no spores are formed in what may otherwise be a normal fruit body). These mutants suggest that fruit body development is organised into different pathways which are genetically separate, though there is genetic evidence that fruit bodies and sclerotia share a common pathway of initiation (Moore, 1981). It is very significant that mutants were obtained with defects in either cap expansion or stem elongation (illustrated in Fig. 44, in Section 11, below). Both processes depend on enormous cell inflation, and the fact that they can be separated by mutation indicates that the same result (increase in cell volume) is achieved by different means (Moore, Elhiti & Butler, 1979). Diagram adapted from Bourne, Chiu & Moore (1996). |
Observations of sclerotium morphogenesis showed that aerial sclerotia arise by development from differentiated sclerotial initials (Waters, Moore & Butler, 1975b) but submerged sclerotia appeared when regions of the submerged mycelium were enclosed and isolated by formation of an enveloping rind layer. It is clear that the aerial and submerged sclerotia of Coprinopsis are not homologous but represent two quite different aspects of sclerotial behaviour in this organism. Indeed, a genetic polymorphism was recognised when it was realised that aerial sclerotia produced by the wild type culture H1 always had a multi-layered rind, whereas those produced by wild type culture ZBw601 always had a rind composed of a single layer of (thick-walled) cells (Hereward & Moore, 1979).
A series of crosses and other genetic tests showed that the H1-type of sclerotium was produced by the recessive gene scl-1H while the ZBw601-type of sclerotium was the dominant wild type (designated scl-1+). Since scl-1H causes the formation of sclerotia having an abnormal proliferation of cells, particularly in the rind, it is thought that the scl-1 gene may normally be involved in the control of the disposition and extent of tissue layers during sclerotium development. Strains related to H1 that were unable to form sclerotia carried a null allele scl-10) and other (unrelated) wild type cultures were unable to form sclerotia because of a genetic character that segregates in each case as a single, recessive, gene. A total of four such genes were identified, symbolised scl-1, scl-2, scl-3 and scl-4.
Genes scl-1 and scl-2 are linked and are members of linkage group III; scl-3 is distantly linked to linkage group IV; and scl-4 dikaryons failed to form fertile fruit bodies, instead they produced fruit body initials that developed into primordia which then aborted, to be replaced by a new crop of initials which behaved similarly. It was concluded that the scl-4 defect was a pleiotropic defect indicating a close relationship between sclerotium and fruit body morphogenesis (Fig. 11) (Waters, Moore & Butler, 1975b; Hereward & Moore, 1979). In a subsequent study, homoallelic dikaryons were constructed and the effect of the sclerotium negative (scl) genes on fruit body formation was investigated. In the homoallelic state these defective genes prevented the formation of both sclerotia and fruit bodies by the dikaryon. Thereby demonstrating that these two structures share a common pathway of initiation (Moore, 1981b).
Aerial sclerotia originated from intercalary cells of aerial hyphae. Initially only a single cell was involved. Repeated branching from the initiation point combined with incoming branches from neighbouring hyphae formed the sclerotium initial which was a more or less spherical mass of undifferentiated, radially arranged cells. Accumulation of glycogen in cells towards the centre of the initial marked the commencement of maturation. Cells of the central (medullary) region went through a differentiation process which involved an initial heavy accumulation of glycogen. Glycogen could be identified and measured by:
- Extraction and chemical analysis;
- Specific cytochemical reactions in sectioned material prepared for observation with the light microscope;
- In the form of electron-dense rosette-shaped bodies, about 300 nm in diameter, observed in the peripheral regions of the cytoplasm of most cells in ultrathin sections prepared for observation with the transmission electron microscope (TEM; see Fig. 13)(Waters, Moore & Butler, 1975b).
As sclerotium maturation proceeded, the accumulated glycogen was then mobilised, its reduction in concentration being exactly correlated with the formation of a thick, hyaline, secondary wall in the majority of the cells making up the central medulla (Fig 12). Finally, as the medulla matured, differentiation of localised areas of cells just within the margin of the initial occurred to form the protective rind layer. Wall thickening in rind cells was not preceded or accompanied by glycogen accumulation.
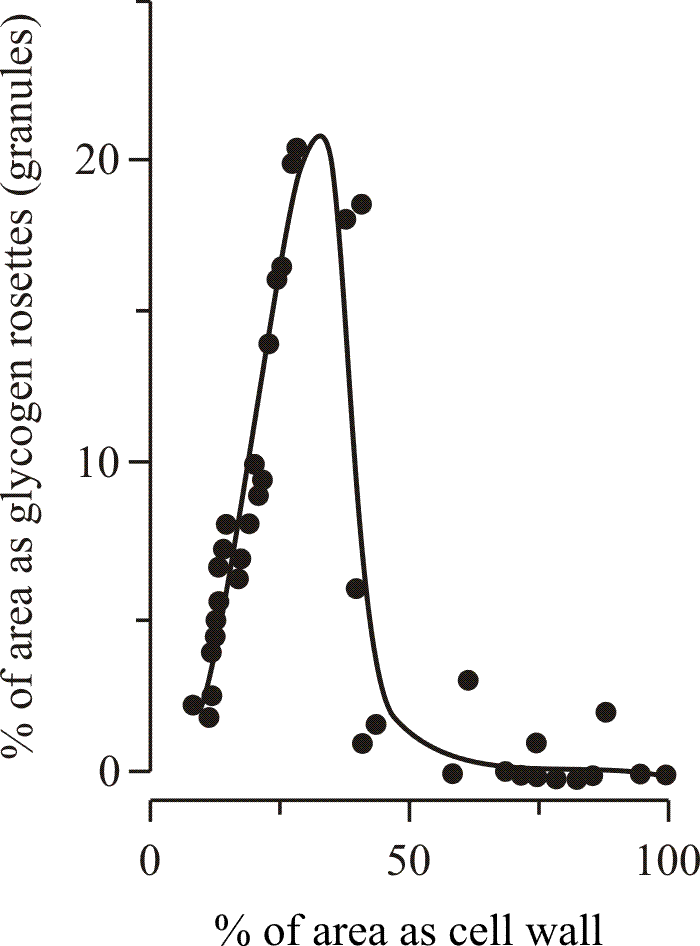 |
| Fig. 12. Involvement of glycogen metabolism in development. Thickening of the secondary wall in medullary cells of sclerotia of Coprinopsis cinerea coincides with the disappearance of glycogen from the cell cytoplasm. Waters, Moore & Butler (1975b) obtained these data from electronmicrographs of ultrathin sections. The area of the sectioned cell profile occupied by glycogen granules on the one hand and by the cell wall on the other hand were each expressed as a percentage of the total area of the cell. In some sections the lumen of the cell was totally occluded by secondary wall. |
Our observations on thick-walled cells found in the sclerotial rind of Coprinopsis (Waters, Butler & Moore, 1972) revealed a basic structure which can best be interpreted as a centripetal extension of the innermost fibrillar layer of the primary hyphal wall. On the other hand, thick-walled cells of the central medulla possessed walls with a completely different substructure. These uniformly thickened walls are some 20 times thicker than the walls of vegetative hyphae and despite their restricted lumen the majority of the cells are living. In both transverse and longitudinal TEM sections of glutaraldehyde-fixed material the walls were clearly bilayered, the outer layer (80-100 nm thick) representing the original hyphal wall within which the inner secondarily thickened wall has been deposited (Fig. 13). This inner layer (usually 1500 to 2000 nm thick) is divided into an outer compact zone and an inner less compact zone, the zonation reflecting different degrees of compaction rather than a change in basic substructure.
It is clear that both zones of the inner layer are composed of unusually thick fibrils (diameter of 33 nm) with a granular substructure embedded in an electron dense matrix (Fig. 13). The thick fibrils are arranged parallel to the longitudinal axis of the cell and are much branched, interwoven and contorted which explains the apparent lack of single fibril profiles in transverse sections (Waters, Butler & Moore, 1972). The fibrils are thought to be composed of glucan and to represent the ultimate long-term carbohydrate store of the sclerotium, which is only recycled to supply carbohydrate resources when the sclerotium germinates.
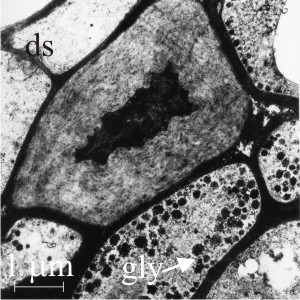  |
| Fig. 13. Secondarily-thickened walls of the central (medulla) region of a young sclerotium of Coprinopsis cinerea. Left hand panel shows a cell with a secondarily-thickened wall in transverse section alongside many normal cells. This secondary wall is constructed of thick fibres of glucan and is eventually recycled to provide carbohydrate resources when the sclerotium germinates. The granules (labelled gly) are accumulations of glycogen, which forms a short-term carbohydrate resource. Accumulation of glycogen occurs before formation of the glucan fibres and as the fibres are formed the glycogen content declines (Fig. 12). Note the dolipore septum (ds) at top left. In the right hand panel medullary cells with secondarily-thickened wall are shown in longitudinal section, illustrating that the thickening (and consequent constriction of the cell lumen) is fairly uniform over the length of the hypha, and that the thickening can cross and involve the dolipore septa. Electronmicrographs prepared by Dr Henry Waters. |
These electron microscope observations that intracellular accumulations of glycogen increase during sclerotium formation and decrease during sclerotium maturation were paralleled by direct chemical analysis. The quantity of glycogen that could be extracted from cultured dikaryotic mycelia of Coprinopsis increased during the first 5 days of growth but subsequently declined. The decline coincided with:
- the main phase of removal of carbohydrate from the culture medium;
- a major reduction in the level of soluble reducing sugars of the mycelium;
- and with the appearance of mature sclerotia.
However, extractable glycogen reserves also accumulated and then dispersed under culture conditions which did not allow sclerotium formation and in strains unable to form sclerotia. It was concluded that glycogen also serves as a transient carbohydrate store for aspects of vegetative mycelial morphogenesis other than sclerotium production (Jirjis & Moore, 1976). Another aspect of the regulation of this is that ammonium produced by the fruit body may prevent sclerotium maturation to give the fruit body preferential usage of glycogen supplies.
Aerial sclerotia of Coprinopsis formed most abundantly in conditions which strongly favoured mycelial growth. With the nitrogen concentration maintained at 25 mM ammonium tartrate the number of sclerotia formed increased as the initial maltose concentration of the medium was increased, reaching a maximum at 25 mM maltose. The length of time required for sclerotium maturation was also minimal on media which initially contained 25 mM maltose. Changing the concentration of ammonium tartrate (in media containing 25 mM maltose) did not markedly affect the total number of sclerotium initials which were formed but had a profound influence on sclerotial maturation. With 5 mM ammonium tartrate maturation occurred most rapidly, and most completely, with 63% of the final total sclerotial yield being matured within 7 days, and 91% within 14 days. Higher ammonium concentrations first delayed and then prevented maturation so that at 100 mM ammonium tartrate less than 0.3% of the initials had matured within 21 days. It is suggested that the ability of ammonium ions to regulate sclerotium maturation can be correlated with the ability of the fruit body to excrete ammonia into the medium so as to provide a mechanism for sequencing the two pathways. While fruit bodies are developing, the ammonium concentration will be maintained at a level which prevents sclerotial maturation, thus avoiding competition for metabolites between the two morphogenetic sequences (Moore & Jirjis, 1976).
With this successful work on sclerotia taking place in my laboratory in Manchester, I decided to make a detailed analysis of Coprinopsis fruit bodies using biochemical assays together with light-, scanning- and transmission electron microscopy to provide details of histology and the levels and distribution of protein, glycogen and glutamate dehydrogenase enzymes during the course of development of stems (also called stipes) and caps (also called pilei [singular = pileus]) of the mushroom fruit bodies (Moore, Elhiti & Butler, 1979). I will return to this line of research in a moment, but first I want to explain our interest in glutamate dehydrogenase enzymes which was expanding at the same time.
Nitrogen metabolism in mushrooms of Coprinopsis. As I mentioned in the introduction, above, in the early 1970s I began a collaboration with George Stewart who was then an equally-young colleague on the academic staff in the Department of Botany at the University of Manchester. George was a biochemist and enzymologist interested in glutamine and glutamate metabolism in flowering plants. I grew mycelium and fruit bodies of Coprinopsis for him to use for comparison with his main research organism (which was then the duckweed, Lemna) and George discovered that NADP-linked glutamate dehydrogenase (NADP-GDH) was derepressed specifically during development of caps of Coprinopsis fruit bodies (then called Coprinus lagopus) but was absent from the stems of those same fruit bodies (Stewart & Moore, 1974). The activity of NADP-GDH steadily increased in the fruit body cap during development but remained at a low level in the parent mycelium and in the stems of the same fruit bodies. In contrast, the NAD-linked enzyme (NAD-GDH) increased in mycelium, stem and cap during this time (Fig. 14).
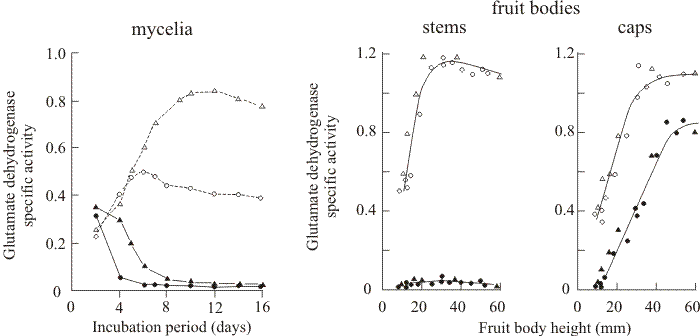 |
| Fig. 14. Specific activities of NAD-linked glutamate dehydrogenase (NAD-GDH; open symbols) and NADP-linked glutamate dehydrogenase (NADP-GDH; solid symbols) in mycelia and fruit bodies of Coprinopsis cinerea. The left hand panel shows enzyme activities in the dikaryon [BC9/6,6 + H1] (circles) and the BC9/6,6 monokaryon (triangles) grown for 16 days as static batch cultures floating on liquid maltose-CM medium. The two panels on the right show specific activities of NAD-GDH (open symbols) and NADP-GDH (closed symbols) in the stems and caps of fruit bodies of different sizes. Fruit bodies were grown either on horse dung (triangles) or as stationary batch cultures with the mycelium floating on liquid maltose-CM medium (circles). Fruit body height is a rough guide to developmental stage (see Table 2, below). Data from Stewart & Moore (1974). |
In vegetative mycelia the two GDH enzymes were regulated reciprocally; NAD-GDH was subject to catabolite repression and urea derepression, while NADP-GDH was catabolite derepressed and repressed by urea. We suggested that NAD-GDH may be the enzyme normally involved in ammonia assimilation in Coprinopsis, with NADP-GDH being reserved for specific functions associated with developmental alterations in metabolism. I subsequently spent several years studying the developmental phenomenon that the increase in NADP-GDH activity in fruit body caps seemed to represent (Fig. 14).
We first followed the same tactics that I had used to study sugar metabolism and examined the effects of a growth-inhibiting isomer/analogue of glutamate. D-glutamate inhibited hyphal extension in Coprinopsis, the degree of inhibition depending on the identity of the glutamate dehydrogenase (GDH) enzyme present in the mycelium. Mycelia were most sensitive to inhibition on media which promoted formation of the NAD-linked GDH. The activity of this enzyme was inhibited by D-glutamate in experiments with cell-free extracts, the inhibitions being noncompetitive or mixed (i.e. although D-glutamate is a stereoisomer of the normal substrate L-glutamate there was no competitive inhibition). Similarly the activity of the NADP-linked enzyme (NADP-GDH) was inhibited in its utilisation of ammonium ions (in the amination reaction) and L-glutamate (in the deamination reaction). In contrast, 2-oxoglutarate was found to be a co-operative substrate for NADP-GDH in the amination reaction and the analogue D-glutamate acted as an allosteric activator in this reaction; also D-Glutamate was able to derepress the synthesis of NADP-GDH, the NAD-linked enzyme being hardly affected (Al-Gharawi & Moore, 1974).
We also carried out a survey of glutamate dehydrogenase activities in a wide range of agaric fruit bodies collected from nature. This showed that an elevated level of NADP-linked glutamate dehydrogenase in fruit body caps is only rarely observed in other agarics (Moore & Al-Gharawi, 1976). Among Coprinus spp. (in the sense of that genus name then current) only C. silvaticus and C. disseminatus, and among other genera only Panaeolus semiovatus, Marasmius oreades and perhaps Hypholoma fasciculare (though here the generally low specific activities lessen the significance of the differences) have a pattern of enzyme activities in any way similar to that regularly observed in several strains of Coprinopsis cinerea. As 27 different species were examined , it is abundantly clear that derepression of NADP-GDH in the fruit body cap is not a feature which is shared by many agarics; nor, even, is it common among Coprinus species and related genera (Moore & Al-Gharawi, 1976). The specific derepression of NADP-GDH in the fruit body cap is something which is particular to Coprinopsis cinerea and the structure and lifestyle of its fruit body. This paper carries an acknowledgement to my daughter Becky for help in collecting these diverse samples. Being just 3 years old at the time she could spot and triumphantly point out a 'mush' many yards away from the vantage point of her pushchair.
This and subsequent research on the metabolic control of morphogenesis has shown convincingly that in Coprinopsis cinerea it is the nitrogen metabolism of the developing cap that has the most direct bearing on its morphology, though there is considerable interplay with carbohydrate and carboxylic acid metabolisms (Fig. 15). Attempts to characterise the metabolism of the developing fruit body have concentrated on enzyme surveys and metabolite measurements. These investigations revealed four enzymes which show large increases in activity in the developing cap while remaining at low levels (or declining in activity) in the stems supporting those caps (Table 1). These four enzymes are:
- NADP-linked glutamate dehydrogenase (NADP-GDH);
- glutamine synthetase (GS) (Stewart & Moore,1974);
- ornithine acetyltransferase (OAT);
- ornithine carbamyltransferase (OCT).
- A fifth enzyme, urease, showed the reverse behaviour, being absent from the cap though present in the stem and, indeed, being constitutive in mycelium (Moore & Ewaze, 1976).
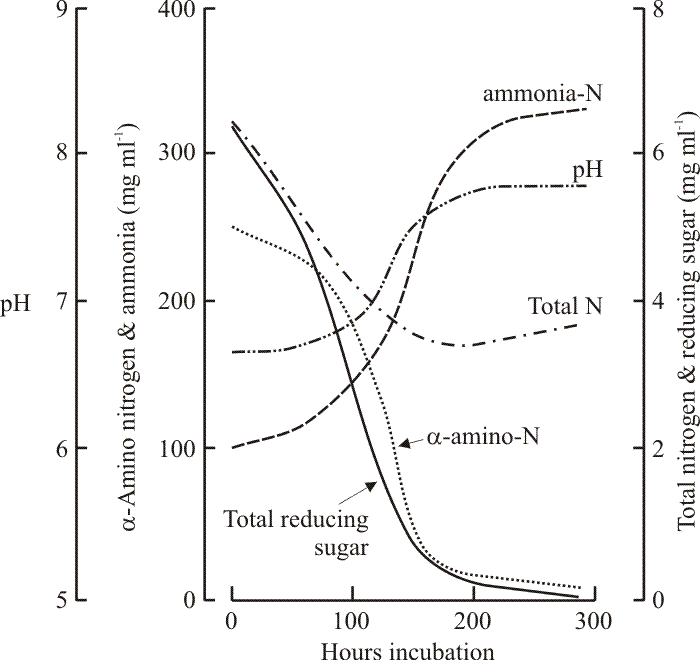 |
| Fig. 15. The nutrient connection with fruit body formation in Coprinopsis cinerea. The graph records the changes which occur in the (maltose-CM) medium during growth of a dikaryon mycelium as it produces fruit bodies. The first fruit body initials were observed after about 100 h, meiosis occurred at about 200 h and spore discharge occurred after about 250 h. Note that the medium became exhausted of sugars and α-amino nitrogen as fruiting was initiated. However, total nitrogen in the medium remained high because large amounts of ammonium were produced (excreted by the mycelium following use of amino acids as carbon sources). The ammonium accumulated in these in vitro cultures. In nature the alkaline pH (itself a result of proton pumping by the hyphae associated with nutrient uptake) would release ammonia gas for dissipation by wind and rain. Data from Stewart & Moore, 1974. |
Table 1. Some enzyme activities in developing fruit bodies of Coprinopsis cinerea |
||||
Enzyme |
Tissue |
Enzyme activity* |
||
Developmental stage |
||||
3 |
4 |
5 |
||
NADP-linked glutamate dehydrogenase |
Cap |
150 |
267 |
830 |
Stem |
12 |
15 |
103 |
|
Glutamine synthetase |
Cap |
300 |
950 |
2067 |
Stem |
85 |
290 |
550 |
|
Ornithine acetyltransferase |
Cap |
16 |
37 |
34 |
Stem |
8 |
7 |
5 |
|
Ornithine carbamyltransferase |
Cap |
353 |
693 |
1240 |
Stem |
153 |
436 |
310 |
|
NAD-linked glutamate dehydrogenase |
Cap |
270 |
553 |
1183 |
Stem |
363 |
483 |
1287 |
|
Urease (note different units) |
Cap |
55 |
70 |
38 |
Stem |
143 |
570 |
4300 |
|
*Except for urease, enzyme activities are shown as nmol substrate used min-1 mg protein-1; urease activity is shown as pmol substrate used min-1 mg protein-1. The stage 3 primordium is beginning to make spores, the stage 4 fruit body has a full complement of (mostly unpigmented) spores, and the stage 4 fruit body is releasing mature spores. Data from Ewaze, Moore & Stewart, 1978. |
||||
Amplification of tricarboxylic acid (TCA) cycle activity is signalled by the observations that succinate dehydrogenase also shows much greater activity in the cap than in the stem, and isocitrate dehydrogenase activity increases in both parts of the fruit body as development proceeds (Ewaze, Moore & Stewart, 1978).
As we shall see, regulation of NADP-glutamate dehydrogenase seems to depend on a circuit involving accumulation of acetyl-CoA in tissues where ammonia is limiting (Moore, 1984a) and this enzyme, together with glutamine synthetase, probably contributes to an ammonium scavenging system. The net result of the shift in metabolism is accumulation of urea, and probably other nitrogenous metabolites, as osmotic solutes which drive water into the cells of the gill hymenium. This leads to inflation of these cells and their expansion can account for the changes in form through which the cap progresses as maturation proceeds. The system exemplifies different sorts of regulation, from substrate level to the gene level, and is an ideal model for study of the causative events that give rise to metabolic shifts which direct differentiation processes (Moore, 1984a).
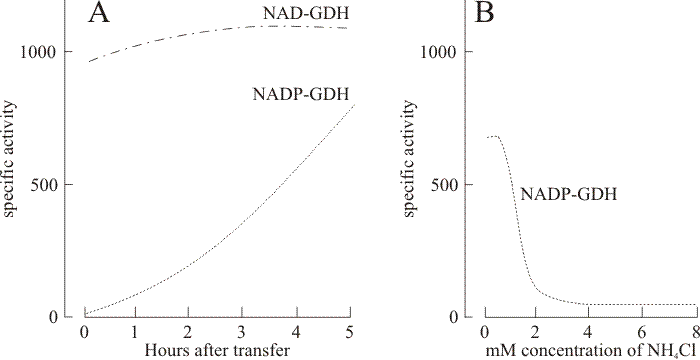 |
| Fig. 16. Generalised results of the standard medium transfer-experiment. Panel A shows the time course of induction of NADP-linked glutamate dehydrogenase activity following transfer of mycelium of Coprinopsis cinerea strain BC9/6,6 to a nitrogen-free medium supplemented with 100 mM pyruvate. The NAD-linked enzyme activity in the same samples remained high and was largely unchanged during this period. Extensive use was made of this medium transfer experiment to study regulation of several enzymes because it induced the same pattern of enzyme inductions in the monokaryotic mycelium as occur in normally-developing fruit body caps (Stewart & Moore, 1974; Al-Gharawi & Moore, 1977). The routine technique was to grow mycelium of the monokaryotic strain number BC9/6,6 (ATTC 42725) in a rich medium for 4 to 5 days to obtain a good mycelial yield and then harvest, wash and resuspend for further incubation in a salts medium containing 100 mM pyruvate and no nitrogen source. The result of this treatment was that the BC9/6,6 monokaryon produced high activities of NADP-GDH, glutamine synthetase (GS), ornithine-acetyl transferase, and ornithine-carbamyl transferase and showed diminished activities of NAD-GDH and urease. Significantly, increases in activity of NADP-GDH and GS were highly correlated (correlation coefficient 0.94) implying some form of coordinate control. The response to the medium transfer was sensitive to inhibition by cycloheximide and experiments using differential isotopic labelling before and after transfer showed that the NADP-GDH protein was synthesised de novo (Jabor & Moore, 1984). The time course of this derepression showed no lag period (panel A) but during the first 5 h after transfer NAD-GDH also increased in activity (the maximum observed being a 40% increase). Only when incubation was continued overnight did the recorded specific activity of NAD-GDH prove to be less than that measured for NADP-GDH. Categorically, therefore, the NAD- and NADP-linked glutamate dehydrogenases in Coprinopsis are not reciprocally regulated. Panel B shows the effect of the inclusion of ammonium chloride in the pyruvate transfer medium on activity of NADP-GDH in mycelia of strain BC9/6,6. Mycelia were harvested for assay 20 to 22 h after transfer to the pyruvate/ammonium chloride medium. Thus, inclusion of ammonium in the transfer medium prevents derepression of ammonium-assimilating enzymes. Therefore it is deduced that NADP-GDH (and GS) form an ammonium-scavenging system. |
The key observations are that the NADP-glutamate dehydrogenase enzyme occurs exclusively in the maturing fruit body cap, stem tissue showing barely detectable levels of activity, and otherwise is found only in mycelium transferred from its growth medium to an ammonium-free medium containing an excess of pyruvate (Fig. 16). Using this latter type of experiment involving mycelium grown first in 14C-labelled medium which was then transferred to 3H-labelled low ammonium + excess pyruvate medium the differential radioactive labelling in total protein and in specific enzyme proteins separated by electrophoresis was measured (Jabor & Moore, 1984). In these experiments the mycelium was first grown in a medium which was supplemented with 14C-leucine so that all proteins formed prior to transfer were labelled with 14C. The pyruvate transfer medium was supplemented with 3H-leucine so that any proteins formed after transfer would be labelled with tritium. After 9 h incubation in the transfer medium the NADP-GDH showed tritium labelling whereas the NAD-GDH showed only 14C-labelling. Only when the transfer incubation was continued to 22 h did the NAD-GDH protein show tritium labelling, implying some turnover of this protein during this extended incubation period. We thus concluded that the NADP-GDH enzyme protein is newly synthesised in the mycelium as the result of a transcriptional derepression event caused by transfer to the pyruvate medium (Jabor & Moore, 1984).
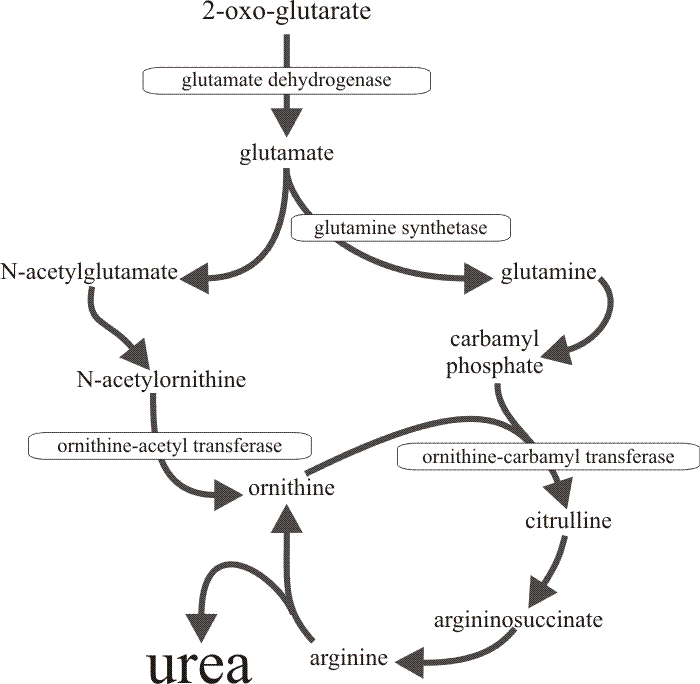 |
| Fig. 17. The metabolic pathway through which the four enzymes which are derepressed together in the developing cap of Coprinopsis cinerea, contribute to urea cycle amplification. The specific repression of urease in the tissues of the fruit body cap (and only the cap) results in accumulation of urea. |
Consideration of the metabolic pathways in which these enzymes are concerned (Fig. 17) leads to the inference that the increases in activity provide for amplification of the urea cycle, leading to accumulation of urea. Feeding live tissue slices with radioactively-labelled citrulline confirmed that urea synthesis and accumulation occurs in vivo in the cap but not in the stem (the latter, of course, having a high urease activity). Urea is not the only compound which is accumulated. Arginine content increases by a factor of four (concentration by a factor of two) as the primordial cap develops to maturity, though both content and concentration decline in the stem during this time.
This situation can be interpreted as a means by which arginase activity is regulated. In Coprinopsis this enzyme has a Km of 100 mM and it can be calculated that the flux through the arginase reaction is likely to increase by a factor of two to three in the cap while declining in the stem as development proceeds from stage 3 (immature fruit body, meiosis ending but spore formation only just starting; see Table 2) to stage 5 (mature fruit body discharging mature spores; see Table 2). Indeed the arginine accumulation will lead to at least a six-fold greater flux through the arginase reaction in the cap than in the stem even though there is little difference between the in vitro measurements of arginase activity of the two tissues. This further strengthens the view that the urea cycle is specifically amplified in developing cap tissues. The level of arginine increases whether quantified in terms of tissue fresh weight or dry weight; but while urea content on a dry weight basis increases by a factor of 2.5, the urea concentration (on a fresh weight basis) is essentially unchanged during cap development (Ewaze, Moore & Stewart, 1978). Among the compounds assayed, urea was the only one to behave like this.
Table 2. Developmental stages of Coprinopsis cinerea fruit bodies |
||
Stage number and trivial name |
Time of appearance (days from inoculation) |
Description |
0. Initials |
4.2-8.4 |
White-cream coloured spheres or egg shapes up to 2 mm in diam. Some suggestion of differentiation occasionally, but never very clear. |
1. Primordia |
5.7-9.1 |
White-cream coloured spheres or egg shapes, 2-6 mm in height. In the larger samples the cap can be distinguished externally and surgically removed. Gill tissues well developed, but basidia (about 12 μm long) not fully differentiated. Karyogamy occurs towards the end of this stage. |
2. Primordia |
6.3-9.9 |
White, 6-9 mm in height. Volva intact initially but becoming more or less free by the end of this stage. Gills beginning to separate, with cystidia about 45 μm long. Basidia about 15-18 μm long. Meiosis occurs during this stage. |
3. Immature fruits |
7.1-10.3 |
White, over 10 mm in height; volva free. The stem, clearly separated from the cap, begins to elongate slowly. Hymenium fully differentiated; cystidia about 60 μm long. Meiosis complete; basidia (about 20 μm long) begin to form sterigmata and spores. A transient stage that can only be recognised with confidence by dissection and microscopic examination. |
4. Immature fruits |
7.7-10.9 |
Height 15-53 mm (average 26.6 mm). Colour varies from white to dark grey as this stage covers the final maturation and pigmentation of the spores. stem continues to elongate slowly. |
5 . Mature fruits |
8.1-13.7 |
Height 19-93 mm (average 45.5 mm). This stage is heralded by the rapid elongation of the stem. Spore discharge begins and as it continues the cap opens out and autolyses. |
Table originally published in Stewart & Moore, 1974. |
||
The conclusion was drawn that during cap development urea accumulation drives water into the cells osmotically. There is certainly a need for considerable water uptake during the later stages of cap development, for the hymenial cells particularly become greatly inflated (Moore, Elhiti & Butler, 1979). This cell expansion is absolutely central to the whole morphogenesis of the developing cap. Mature gill hymenia are largely made up of paraphyses and these cells increase most dramatically in size (Fig. 18). Expansion of these cells therefore increases the area of the gill plate but since this is bounded on its outer edge (i.e. the edge furthest from the stem) by an inextensible, but flexible, layer of outer cap tissue, the increase in gill area is accommodated by a curling of the gill away from the stem (Moore, Elhiti & Butler, 1979) (Fig. 18). Thus the changes in cap morphology which characterise the maturation process can be accounted for by inflation of hymenial cells, and this depends on osmotic influx of water driven by the substrate accumulations which are a consequence of the metabolic shifts discussed above.
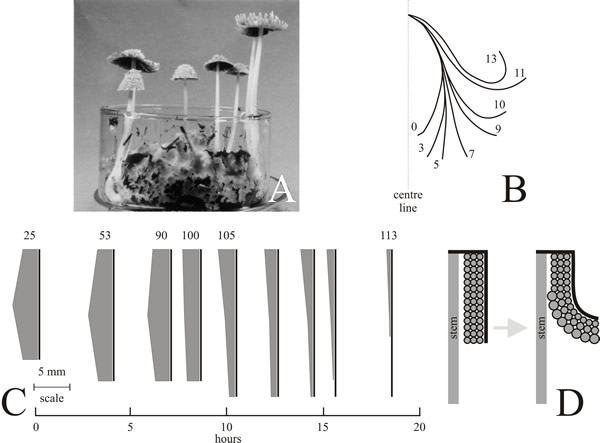 |
| Fig. 18. Mechanics of final maturation of the fruit body cap of Coprinopsis cinerea. A. Photograph of the organism fruiting on compost in a 9 cm diameter crystallising dish. B. Diagrams recording the way in which the profile of the cap changes during its final phase of expansion. Consecutive photographs were made of the same fruit body as it matured and tracings were then made of the upper edge of the cap profile. Numbers show hours elapsed since observation started at time zero. During the course of the sequence shown the stem extended from 25-93 mm, spore discharge commenced about 5 h from the start of observation. C. Scale drawings of gill growth and autolysis. At regular intervals in the final stages of fruit body development a small segment was surgically removed from an otherwise undisturbed fruit body and preserved in formalin. Subsequently, the outer contour length (length of cap flesh or pileipellis) was measured and the depth of gill tissue measured at the top, centre and bottom of a suitable primary gill in each segment. In these diagrams the shape of the cap is ignored (for which see B); the vertical bars represent the contour length and the shaded area represents the gill lamella. The numbers above the diagrams record the length (in mm) of the stem at the time the sample was taken. In this specimen, spore discharge began at about the 7th hour. These observations show that the cap flesh remains intact and extended throughout the entire period of gill autolysis, and that for the final period of cap development the length of the cap flesh is unchanged. D. Development of the fruit body cap in Coprinopsis cinerea. Diagram to show how cell expansion in the hymenium can account for the outward bending of the gills (as indicated in the profiles shown in B) if it is assumed that the cap flesh (pileipellis) acts as a flexible but inextensible outer boundary (shown as a thick black line). Diagrams redrawn using figures from Moore, Elhiti & Butler (1979). |
We used electrophoresis to examine the breadth of protein and enzyme differences between mycelia and the tissues of the fruit body. Electrophoresis employs cell-free homogenates, but the concentrative effects of the process coupled with the specificity of enzyme staining methods provide a highly sensitive procedure for detection of low levels of enzyme activity. Initially, we compared electrophoretic and spectrophotometric measurements of glutamate dehydrogenase enzyme activity in mycelia and developing fruit bodies. The results corroborated and expanded those of earlier reports (Jirjis & Moore, 1979). Subsequently, acrylamide gel electrophoresis was used to resolve buffer-soluble proteins and enzymes extracted from various tissues of Coprinopsis cinerea (Moore & Jirjis, 1981). The electrophoretograms of soluble proteins of two related but compatible monokaryons differed from one another, and both differed from the electrophoretogram of the dikaryon made by crossing the monokaryons together. The electrophoretogram of the youngest fruit body primordia was markedly different from that of the dikaryon on which they were produced, and the protein spectrum of both cap and stem altered as the tissues matured. The protein electrophoretic pattern observed in the cap was always different from that of the stem on which the cap was borne.
However, when fruit bodies of quite different dikaryons were compared it was found that differences between the strains were so considerable that it was not possible to identify features common to a particular tissue or structure. Variation was also found in respect of isozyme patterns even though only two quite closely related monokaryons were compared. In the case of two enzyme activities (malate dehydrogenase and NADPH-dehydrogenase) the monokaryons exhibited different numbers of isozymes, and in a further three (alcohol dehydrogenase, NADH-dehydrogenase and esterase) there were clear differences in the way in which the isozyme pattern in each monokaryon related to the period of growth. The dikaryon was not associated with any predictable change in the isozyme pattern, but in all cases the dikaryon was in some way different from both parental monokaryons. Further differences were observed in fruit body tissues: in all cases the fruit body differed from its parental dikaryon. In most cases this difference was expressed as a distinctive developmental pattern of isozymes which were also detectable in mycelium; and in this the cap was often quite different from the stem. However, for alcohol dehydrogenase and esterase, extracts of fruit body tissues possessed isozymes not detectable in extracts of mycelia (Moore & Jirjis, 1981).
Experimentation with vegetative cultures has shown that the basic features of NADP-GDH are that induction occurs when acetyl-CoA accumulates in the mycelium in the virtual absence of ammonium (Moore, 1981c). This correlates extremely well with observations made on fruit bodies. Assays of normal fruit bodies show that glycogen is accumulated to high levels in the fruit body cap, but is metabolised as the cap matures (Moore, Elhiti & Butler, 1979). During this process both isocitrate dehydrogenase and succinate dehydrogenase are elevated in activity in the cap, implying enhanced metabolism through the TCA cycle (Moore & Ewaze, 1976). There is good evidence that the TCA cycle in Coprinopsis cinerea proceeds through the glutamate decarboxylation loop (Ewaze, Moore & Stewart, 1978). Thus 2-oxoglutarate amination is a necessary component of TCA cycle reactions and if the TCA cycle activity is to be amplified, this amination step must be amplified too. However, the cap always contains less free ammonium than does the stem and the concentration of this metabolite declines drastically as the primordium develops into the mature fruit body (Ewaze, Moore & Stewart, 1978).
Metabolism of up to 2 mg of glycogen per fruit body with little available ammonium could obviously lead to accumulation of acetyl-CoA to levels sufficient to induce NADP-GDH and associated enzymes because of the overall rate-limiting effect at the 2-oxoglutarate amination step normally carried out by NAD-linked glutamate dehydrogenase. We believe that the NADP-GDH and glutamine synthetase together form an ammonium-scavenging system which is induced to safeguard the requirements of both the TCA and urea cycles under these metabolic conditions in the fruit body; NADP-GDH having a ten-fold higher affinity for ammonium than the NAD-linked enzyme (Al-Gharawi & Moore, 1977).
At this stage I do not wish to take this metabolic description any further. Clearly, we have identified a system of enzymes which serve a distinct purpose during cap development. These enzymes exhibit a variety of levels of control; some are quite evidently derepressed by controls which must operate at the gene level, one is repressed in an apparently coordinated way, and there is substrate-level regulation too, including an allosteric control of NADP-GDH activity which is apparently related to accumulation of the substrate and which therefore again implies that ammonium availability is rate-limiting for the TCA cycle (Al-Gharawi & Moore, 1977). These various phenomena are evidently integrated during development so as to provide for the maturation of the fruit body cap (Moore, 1984a; Rosin, Horner & Moore, 1985). [TOP]
Developmental Biology of Higher Fungi A Symposium Volume of The British Mycological Society of an international meeting held at the University of Manchester in April 1984, and originally published in 1985, this book describes research on the ecological, structural, physiological, genetic and molecular factors that control morphogenesis in the higher fungi. The topics range from the relation between organism and substrate to problems associated with the production of mushrooms in commercial conditions, and include accounts of research on biochemical, molecular and structural aspects of mushroom fruit body development. Thus both pure and applied studies of the biology of basidiomycetes are included in this volume, which provides a detailed synthesis of the area, by authors of the highest calibre. |
Moore, D., Casselton, L.A., Wood, D.A. & Frankland, J.C. (eds) (1985). Developmental Biology of Higher Fungi. Cambridge, UK: Cambridge University Press. 615 pp. ISBN-10: 0521301610, ISBN-13: 9780521279253. View: http://www.cambridge.org/gb/knowledge/series/series_display/item3936839/?site_locale=en_GB. |
[TOP]
Updated December 7, 2016